Data Table / Grid UI Kit
A downloadable tool
Every Godot developer building a tool, dashboard, or data-heavy screen eventually asks the same question: "how do I make a table like Excel in Godot?" Most answers point to editor-only spreadsheet plugins — useful for you to manage data, but useless for showing data to your actual users while the app is running.
This kit fills that gap.
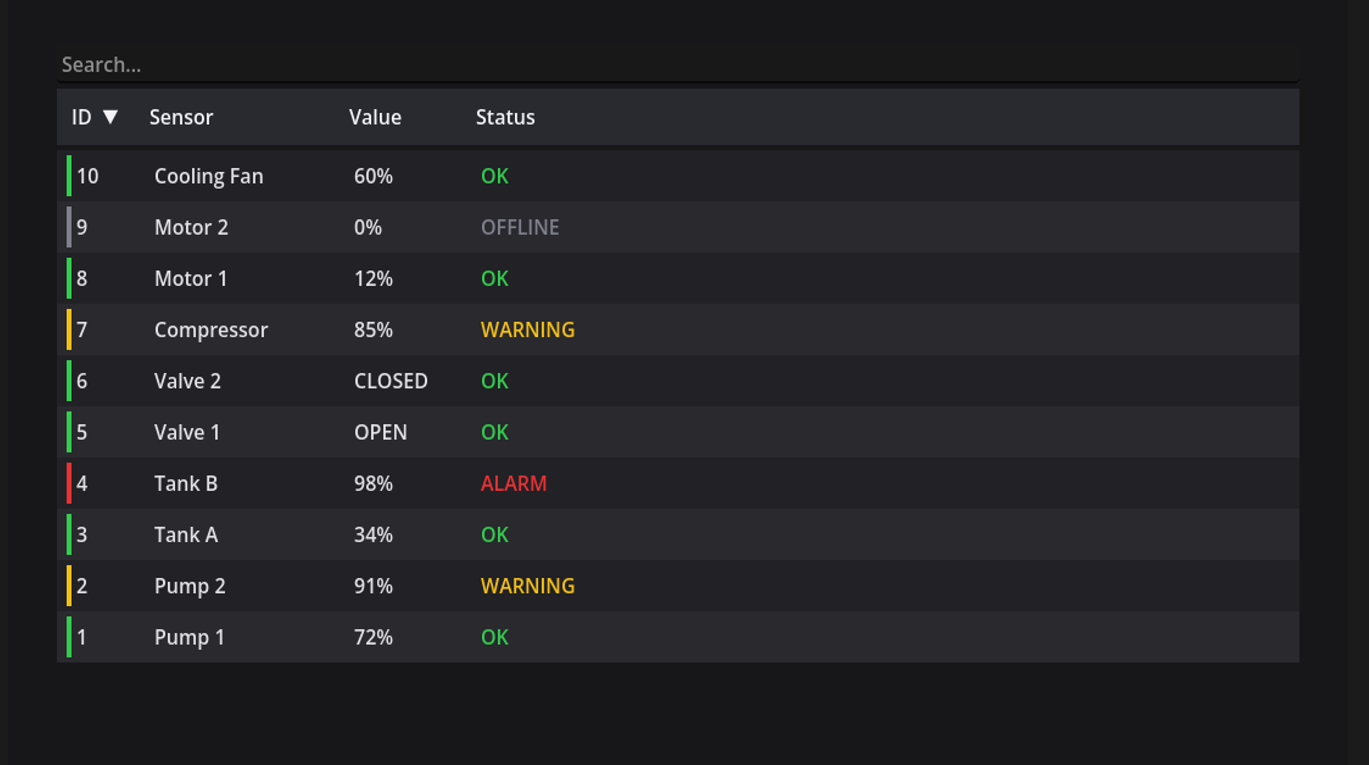
🔤 Sortable columns — click any header to sort ascending/descending, with a visual indicator arrow. Sorting is numeric-aware, so values like "9%" and "72%" sort by magnitude, not alphabetically.
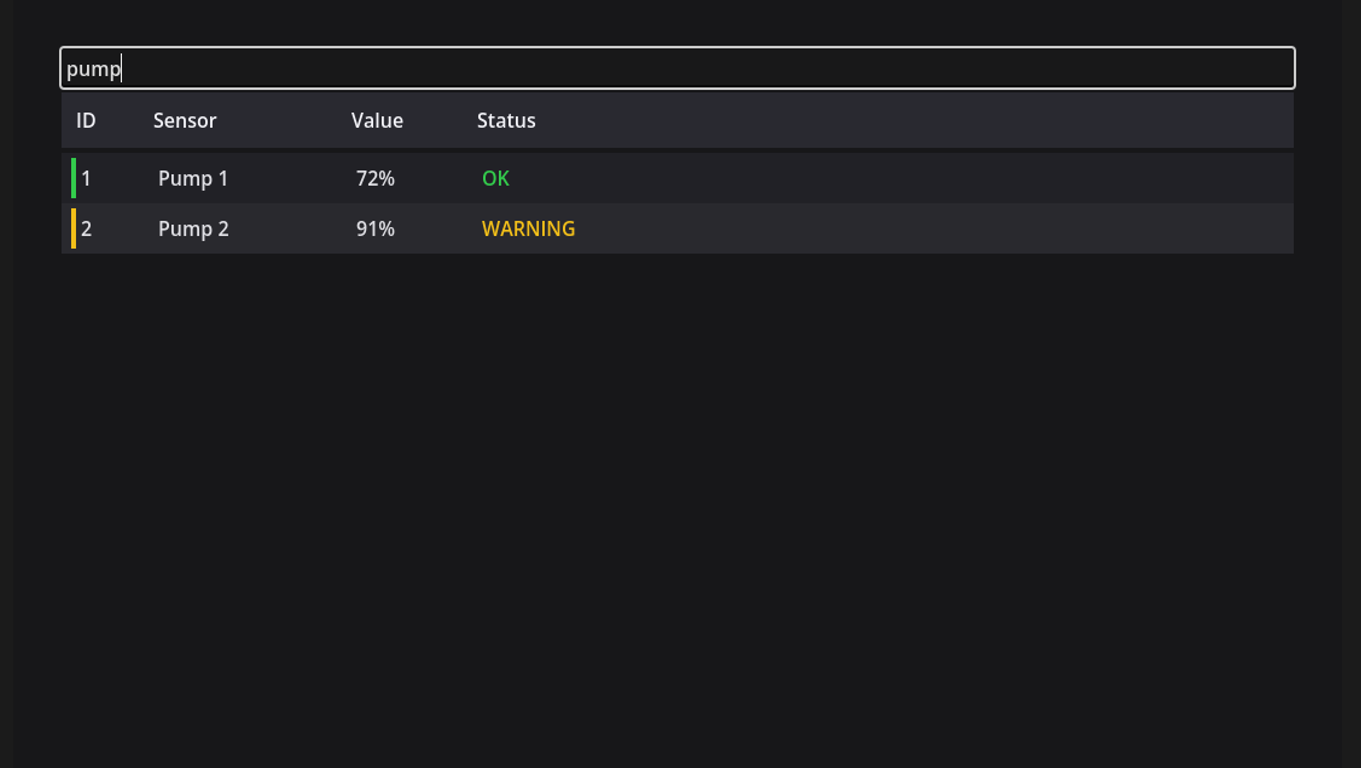
🔍 Built-in search — a search bar filters across all columns at once, no configuration needed.
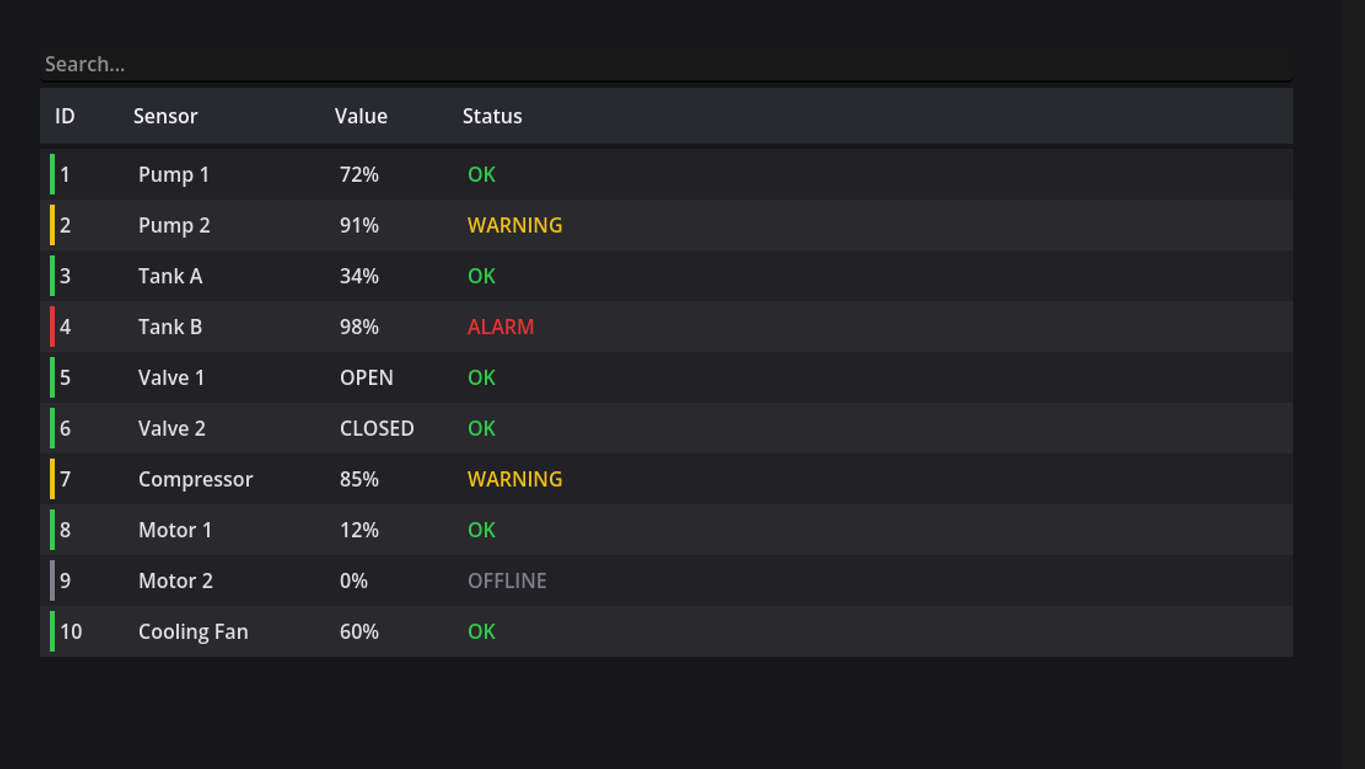
🚦 Status-based row highlighting — color rows based on any column's value (e.g. OK / WARNING / ALARM), using the same color-zone approach as the Industrial Gauges & Indicators Kit, for a consistent look across your dashboard.
📊 Live data, not static content — call set_rows() any time your underlying data changes, and the table rebuilds itself while preserving whatever sort or search filter is active.
Why this kit
- Solves the runtime problem, not the editor problem — this is a UI component for your end users, not a data-management tool for you.
- No external assets or dependencies — pure GDScript, easy to read and extend.
- Not game-specific — equally useful in games, internal tools, or general software built with Godot.
- Designed to pair with Industrial Gauges & Indicators Kit — shared visual language (color zones/status) means the two combine into a cohesive dashboard.
Includes
- DataTable component (sorting, search, status coloring)
- DataTableColumn resource for defining columns
- Full documentation (README) with usage examples
- MIT license — commercial use allowed
Purchase
In order to download this tool you must purchase it at or above the minimum price of $5 USD. You will get access to the following files:
Leave a comment
Log in with itch.io to leave a comment.